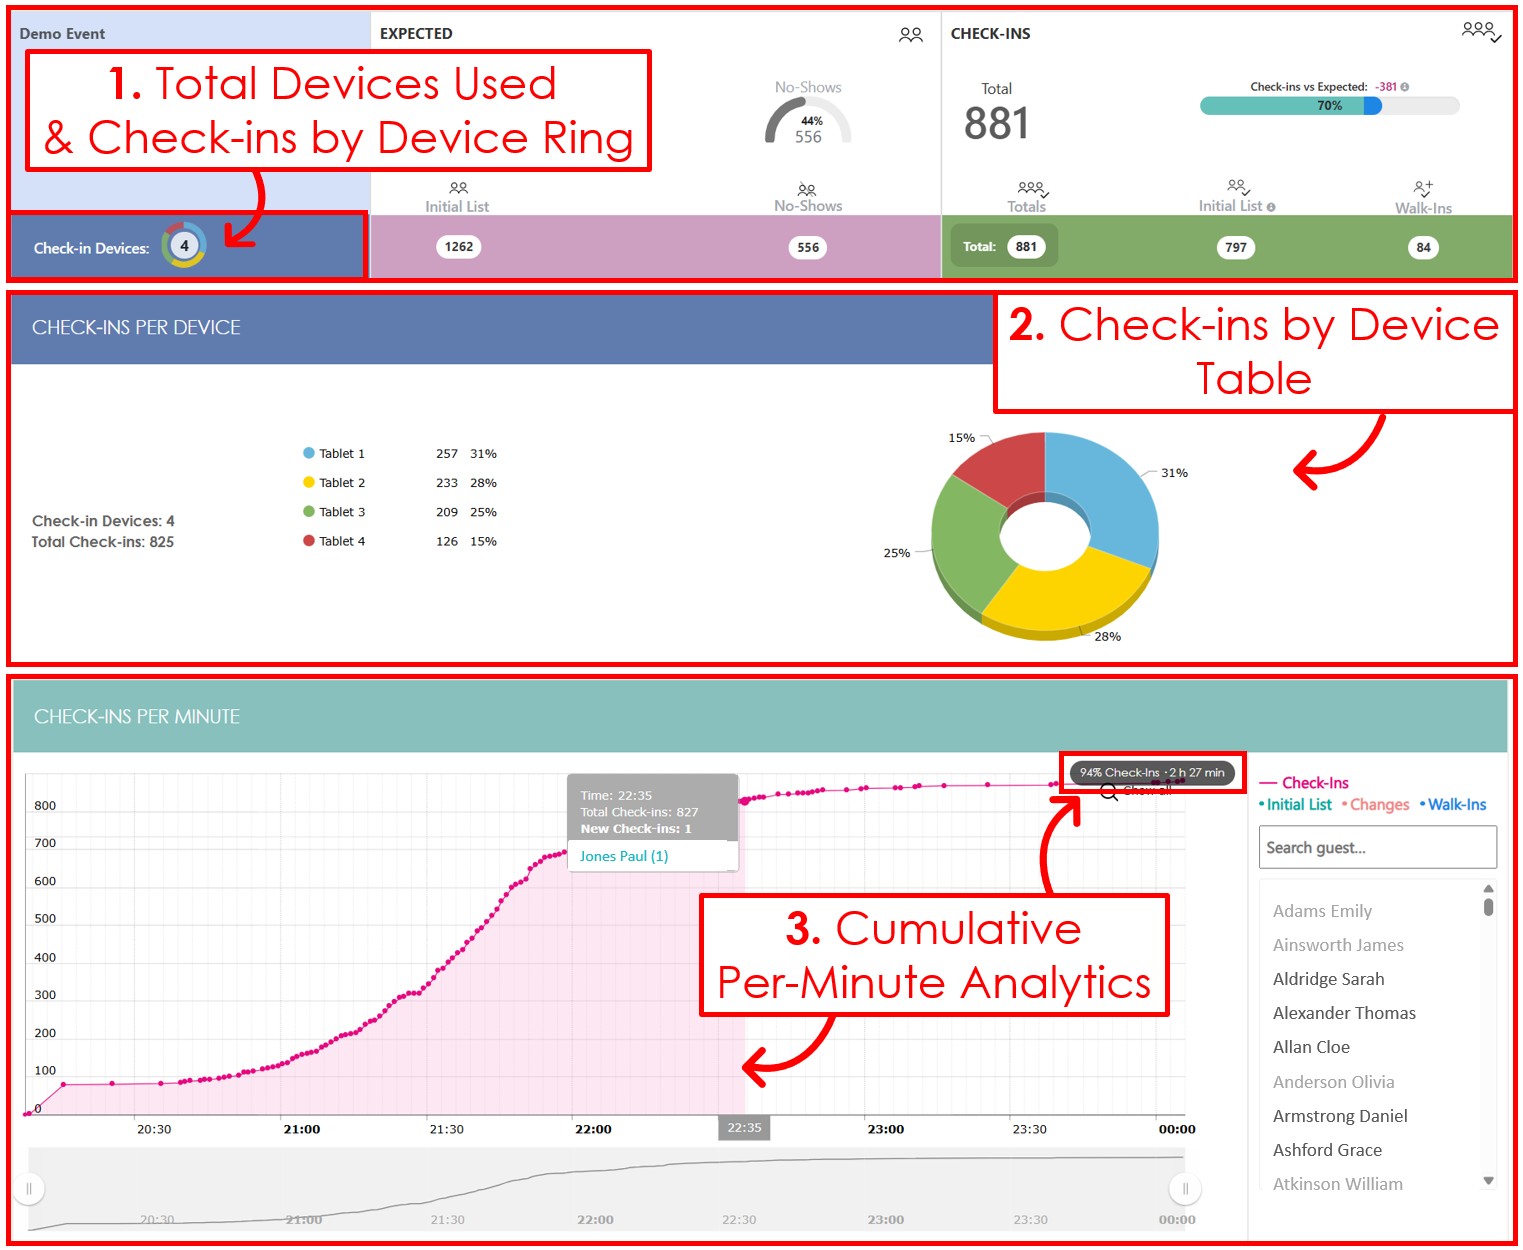
Our latest web check-in app update (v2.3) adds three new report insights:
- ✔ Total check-in devices used
- ✔ Check-ins by device analysis (%)
- ✔ Cumulative check-ins-per-minute analytics
Here’s a quick visual summary:
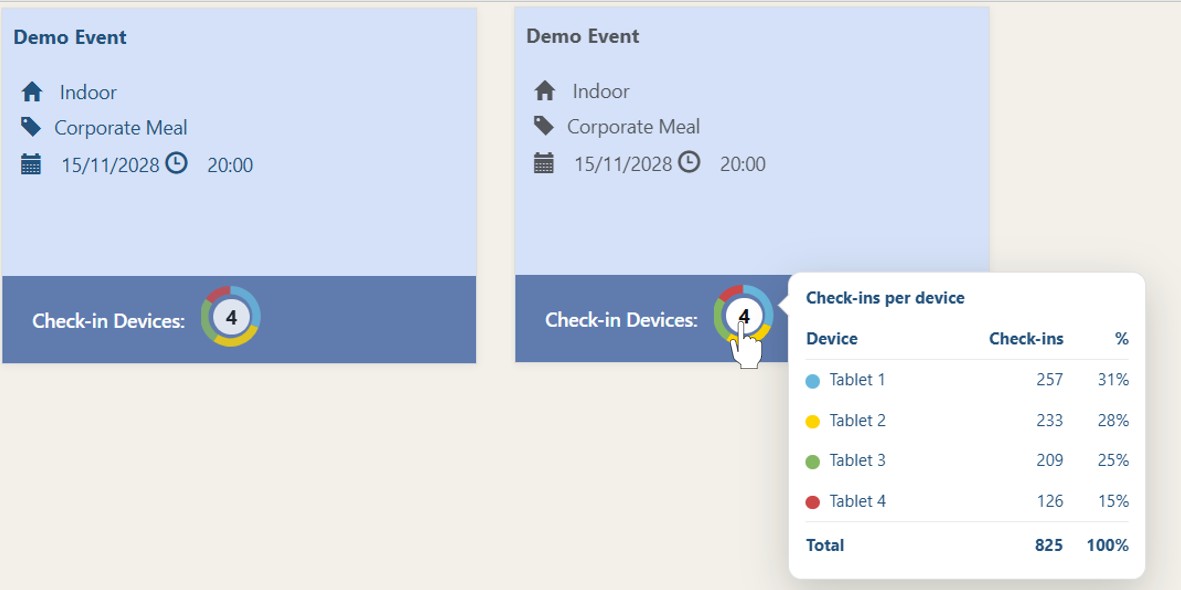
Total check-in devices used
You can now see how many check-in devices were used in your event.
The colored ring shows check-ins by device, so you can instantly see which devices handled most of the check-ins.
Hover over the ring to view the detailed breakdown. Need even more detail? Click the ring to go to the dedicated Check-ins by Device table.
Check-ins by device table
For a deeper breakdown, scroll to the bottom of the Statistics page to view the new Check-ins by Device table.
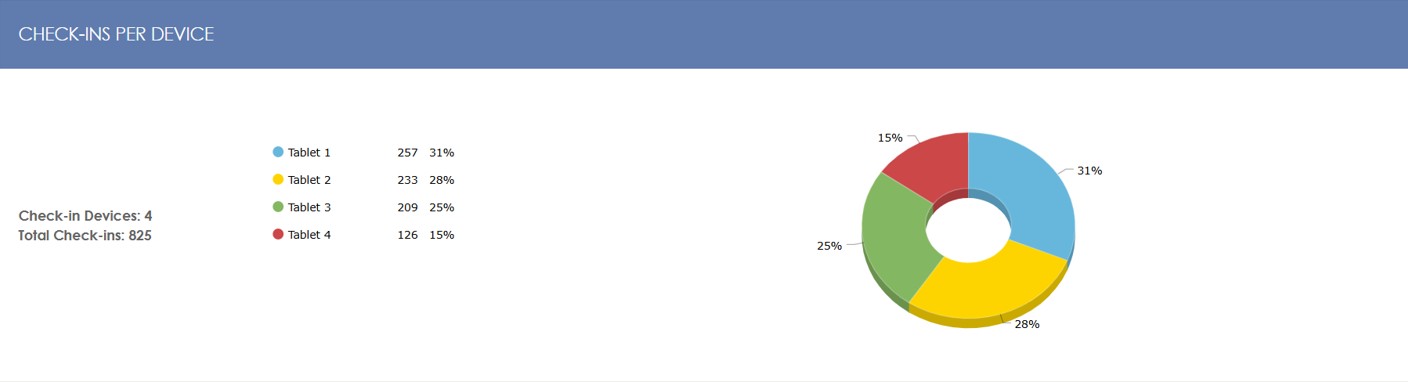
This matches the colored ring above, showing in a 3D-pie chart the percentage of check-ins completed on each device.
Cumulative check-ins-per-minute analytics
We also upgraded the Check-ins Per Minute chart to show cumulative check-in progress and the time elapsed since the first check-in for any selected check-in.
This makes it easier to measure check-in speed and pacing, and it can reveal late-arrival patterns that help you optimize reception staffing for similar future events.
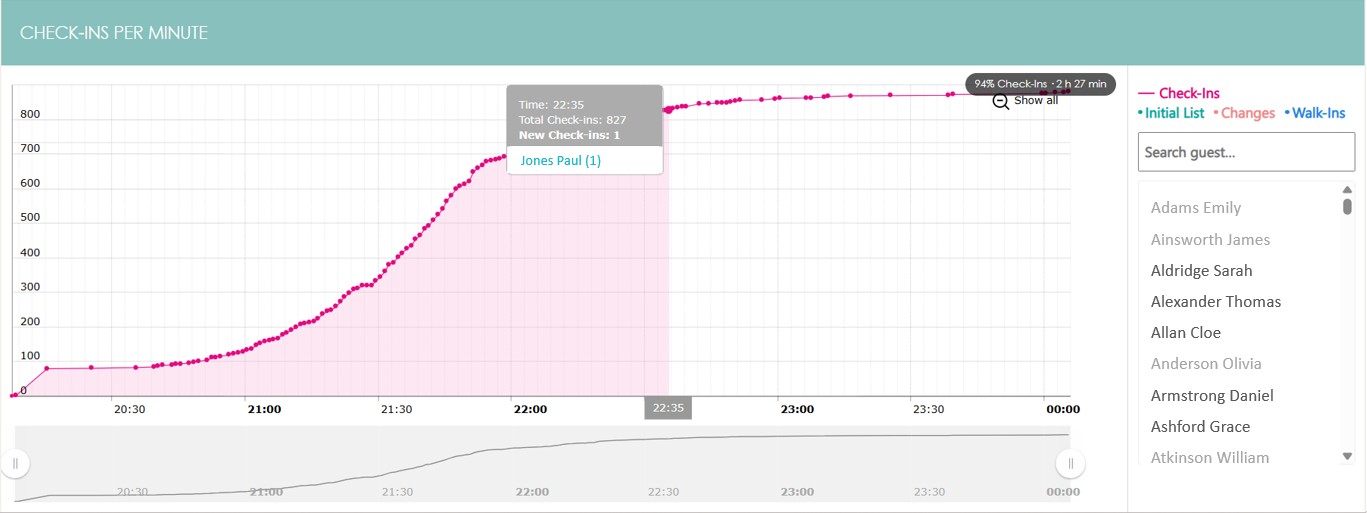
In the example above, Jones Paul was checked in 2 hours and 27 minutes after the first check-in. At that point, 94% of check-ins were complete.
In summary
We are confident that the v2.3 additions will help you understand your check-in flow more clearly and in greater detail.
Find out more about the Check-in app or create a Demo Account!