The latest web release of the Check-in app (v2.2) is now live with new features and capabilities.
In this post, we highlight the upgraded Check-in reports that make tracking arrivals, no-shows, walk-ins and last-minute changes easier than ever.
The Event Attendance Summary Tables
Your entire event is summed up in just two tables:
- ● How many attendees were expected
- ● How many actually arrived
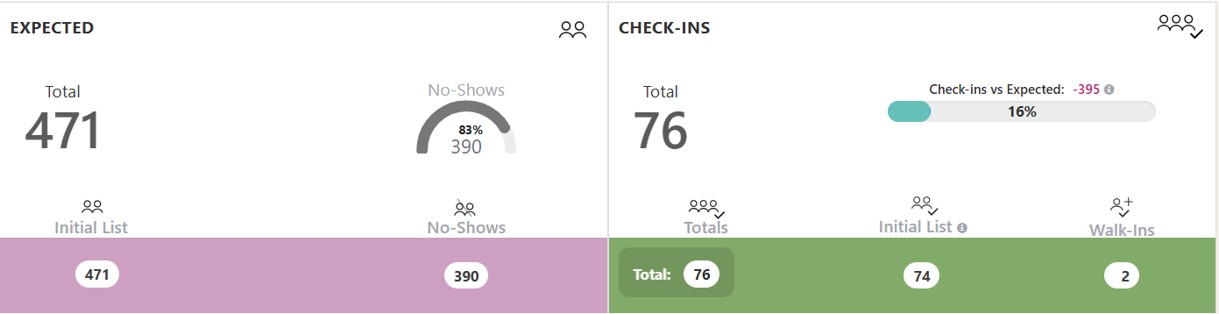
The main event tables also include an analysis of:
- ✔ No-shows
- ✔ Walk-ins
- ✔ Last-minute changes
If you split guests into different age groups (e.g. adults, babies, children), these will show automatically as per your event settings.
Check-ins per Minute & Guest Search
Right after the main tables, you will find the updated Check-ins per Minute chart.
The chart now marks each arrival with a dot. With a mouse-over, you can see the check-in details at that specific minute.
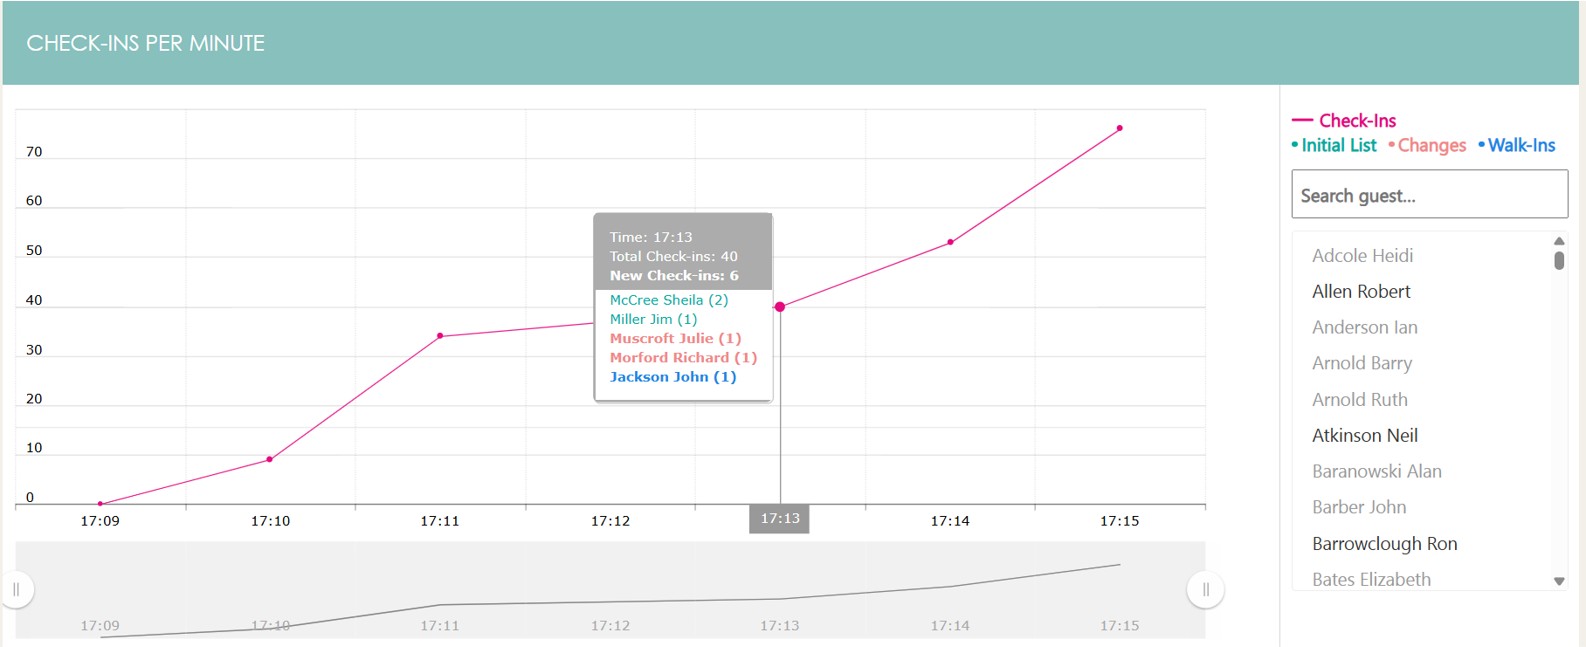
Right next to the chart (or below it, depending on your screen), we added a full Guest-List Search.
As soon as you start typing, the list is filtered returning all the guest matches irrespectively of whether they checked-in, or were a no-show. No-show guests are grey to set them easily apart.
If you click on a name, you get that attendee’s full check-in details, and they are also highlighted on the chart to see who else arrived in that minute, whether that time window was busy or quiet, if they arrived at the start, middle, or end of the event and so on.
Updated Tables
We have updated the tables for the separate guest categories (No-shows, Check-ins, Last-Minute Changes, Walk-Ins).
Regarding the Last-Minute Changes and Walk-ins tables, we now distinguish between Check-ins and Totals enabling you to cover edge cases, such as a walk-in guest who shows at the entrance, but is never actually checked in.
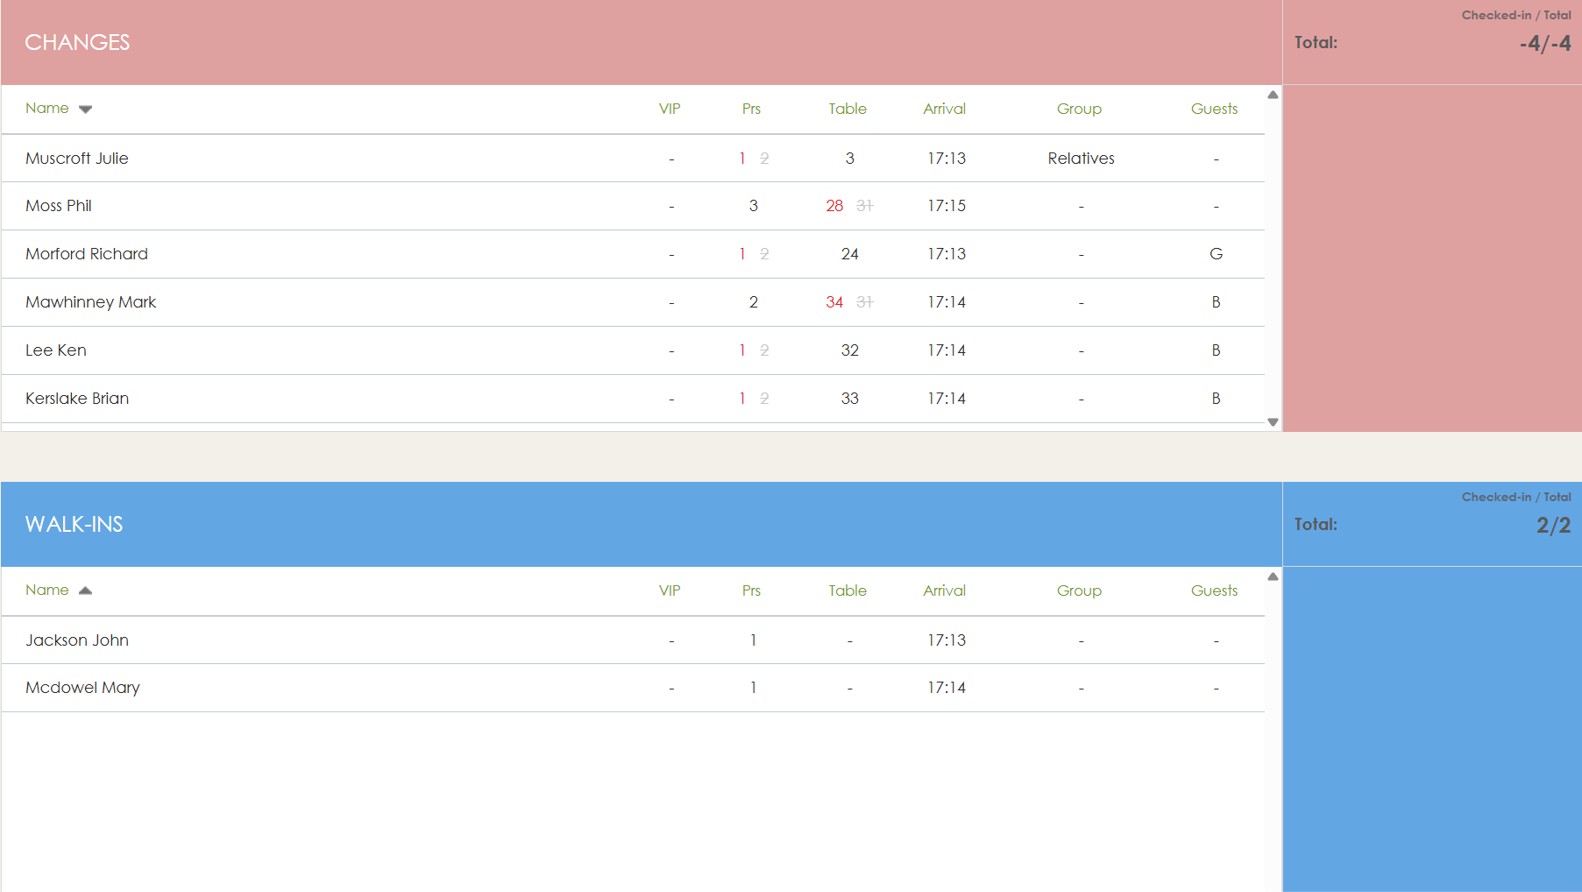
These scenarios may not be common, but as rightly pointed out, they confirm the reliability of the app.
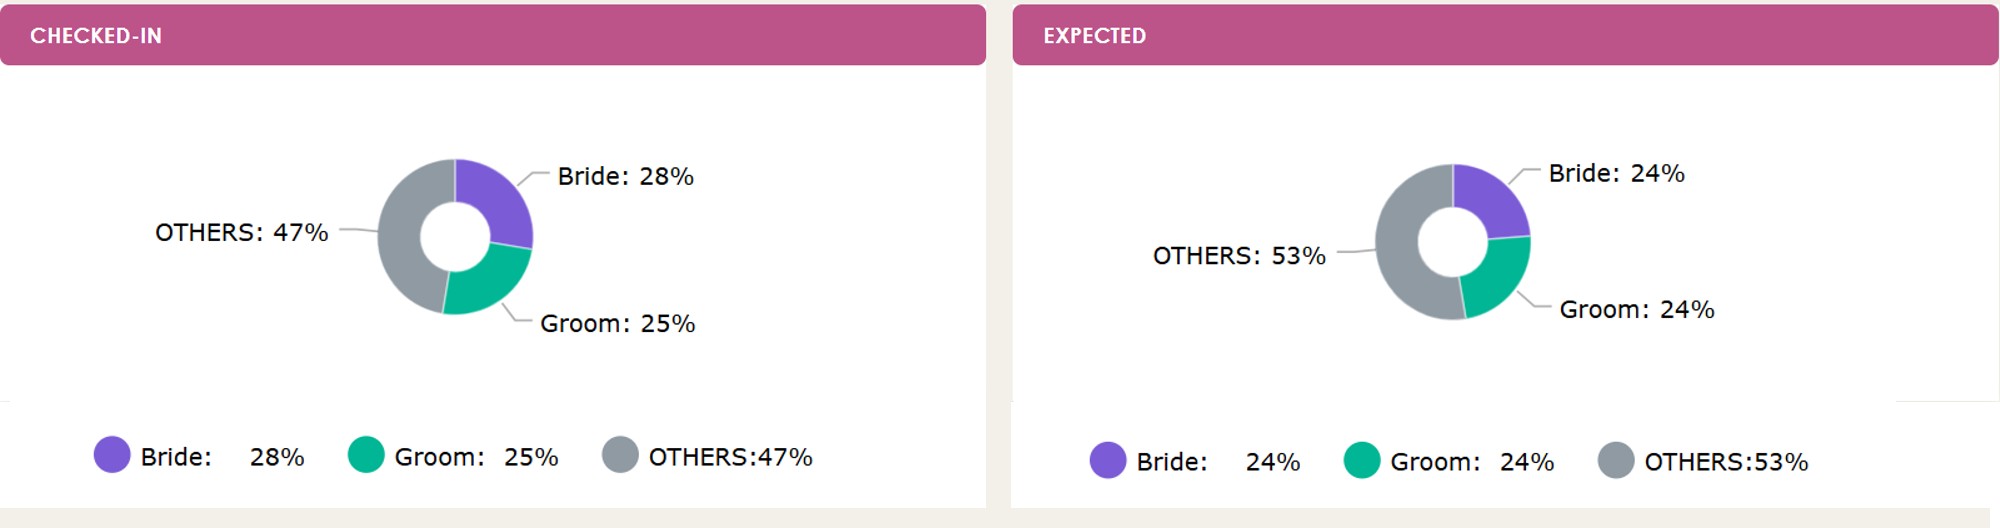
Check-ins vs Expected Analysis by Subcategory
We upgraded the Check-ins vs Expected analysis by guest subcategory (e.g. groom’s guests, bride’s guests, or invitations, ticket holders, etc.). We merged the previously separate Number and Percentage columns together, and added a new Difference column to make sense of the table more easily.
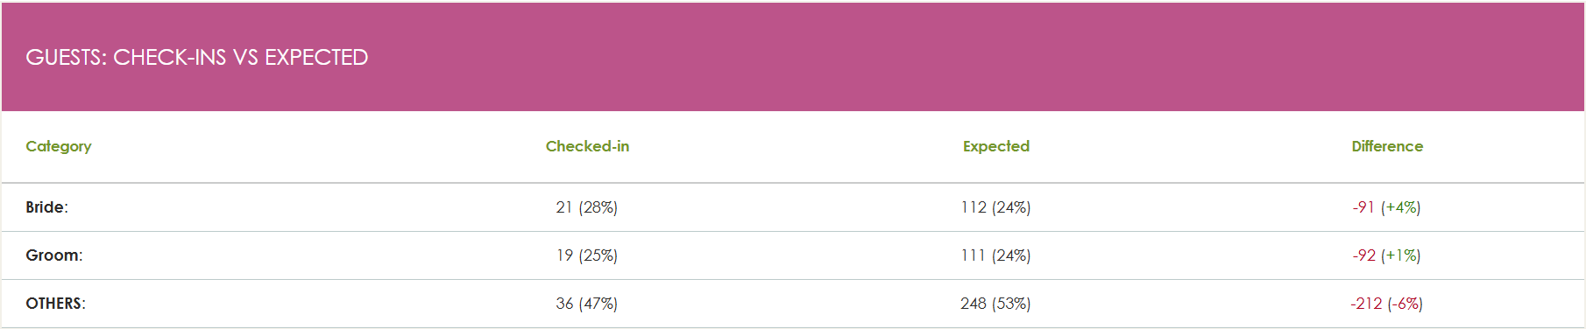
We’ve also turned this analysis into two pie charts, so you can see the big picture at a glance.
Excel Export
Last but not least, the Excel export has been also upgraded. In one click, you receive a single workbook with five tabs — Arrivals, Changes, Walk-ins, No-shows, and Summary — ready for quick sorting and filtering.
Thank you for continuously giving us feedback on your needs.
Happy check-ins!
Find out more about the Check-in app or create a Demo Account!